Graph Area
Legend
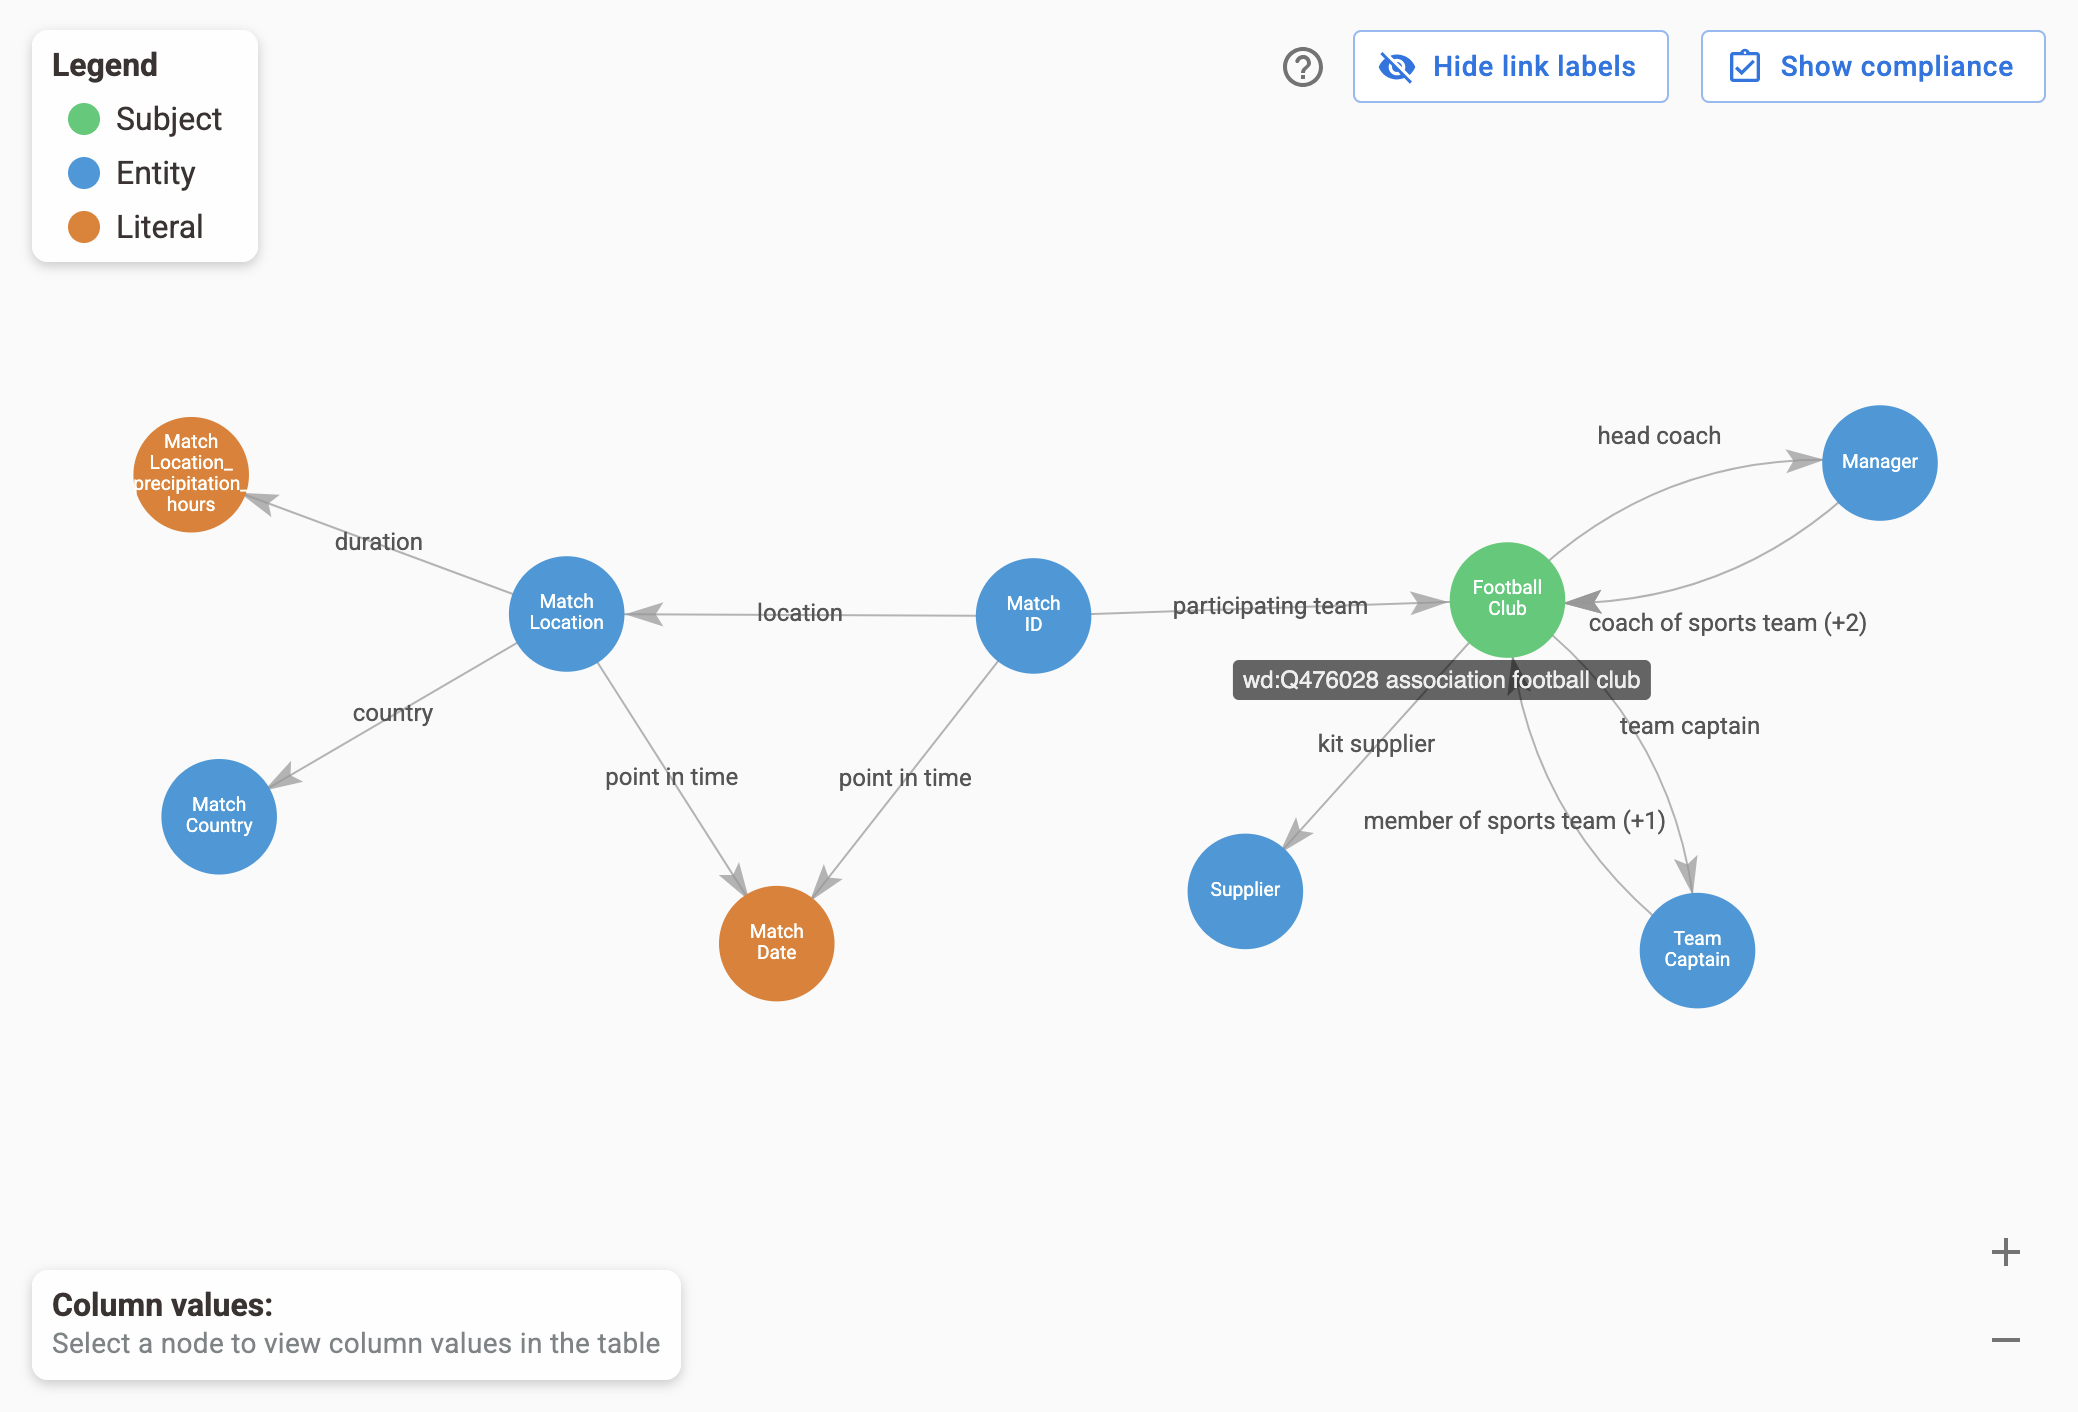
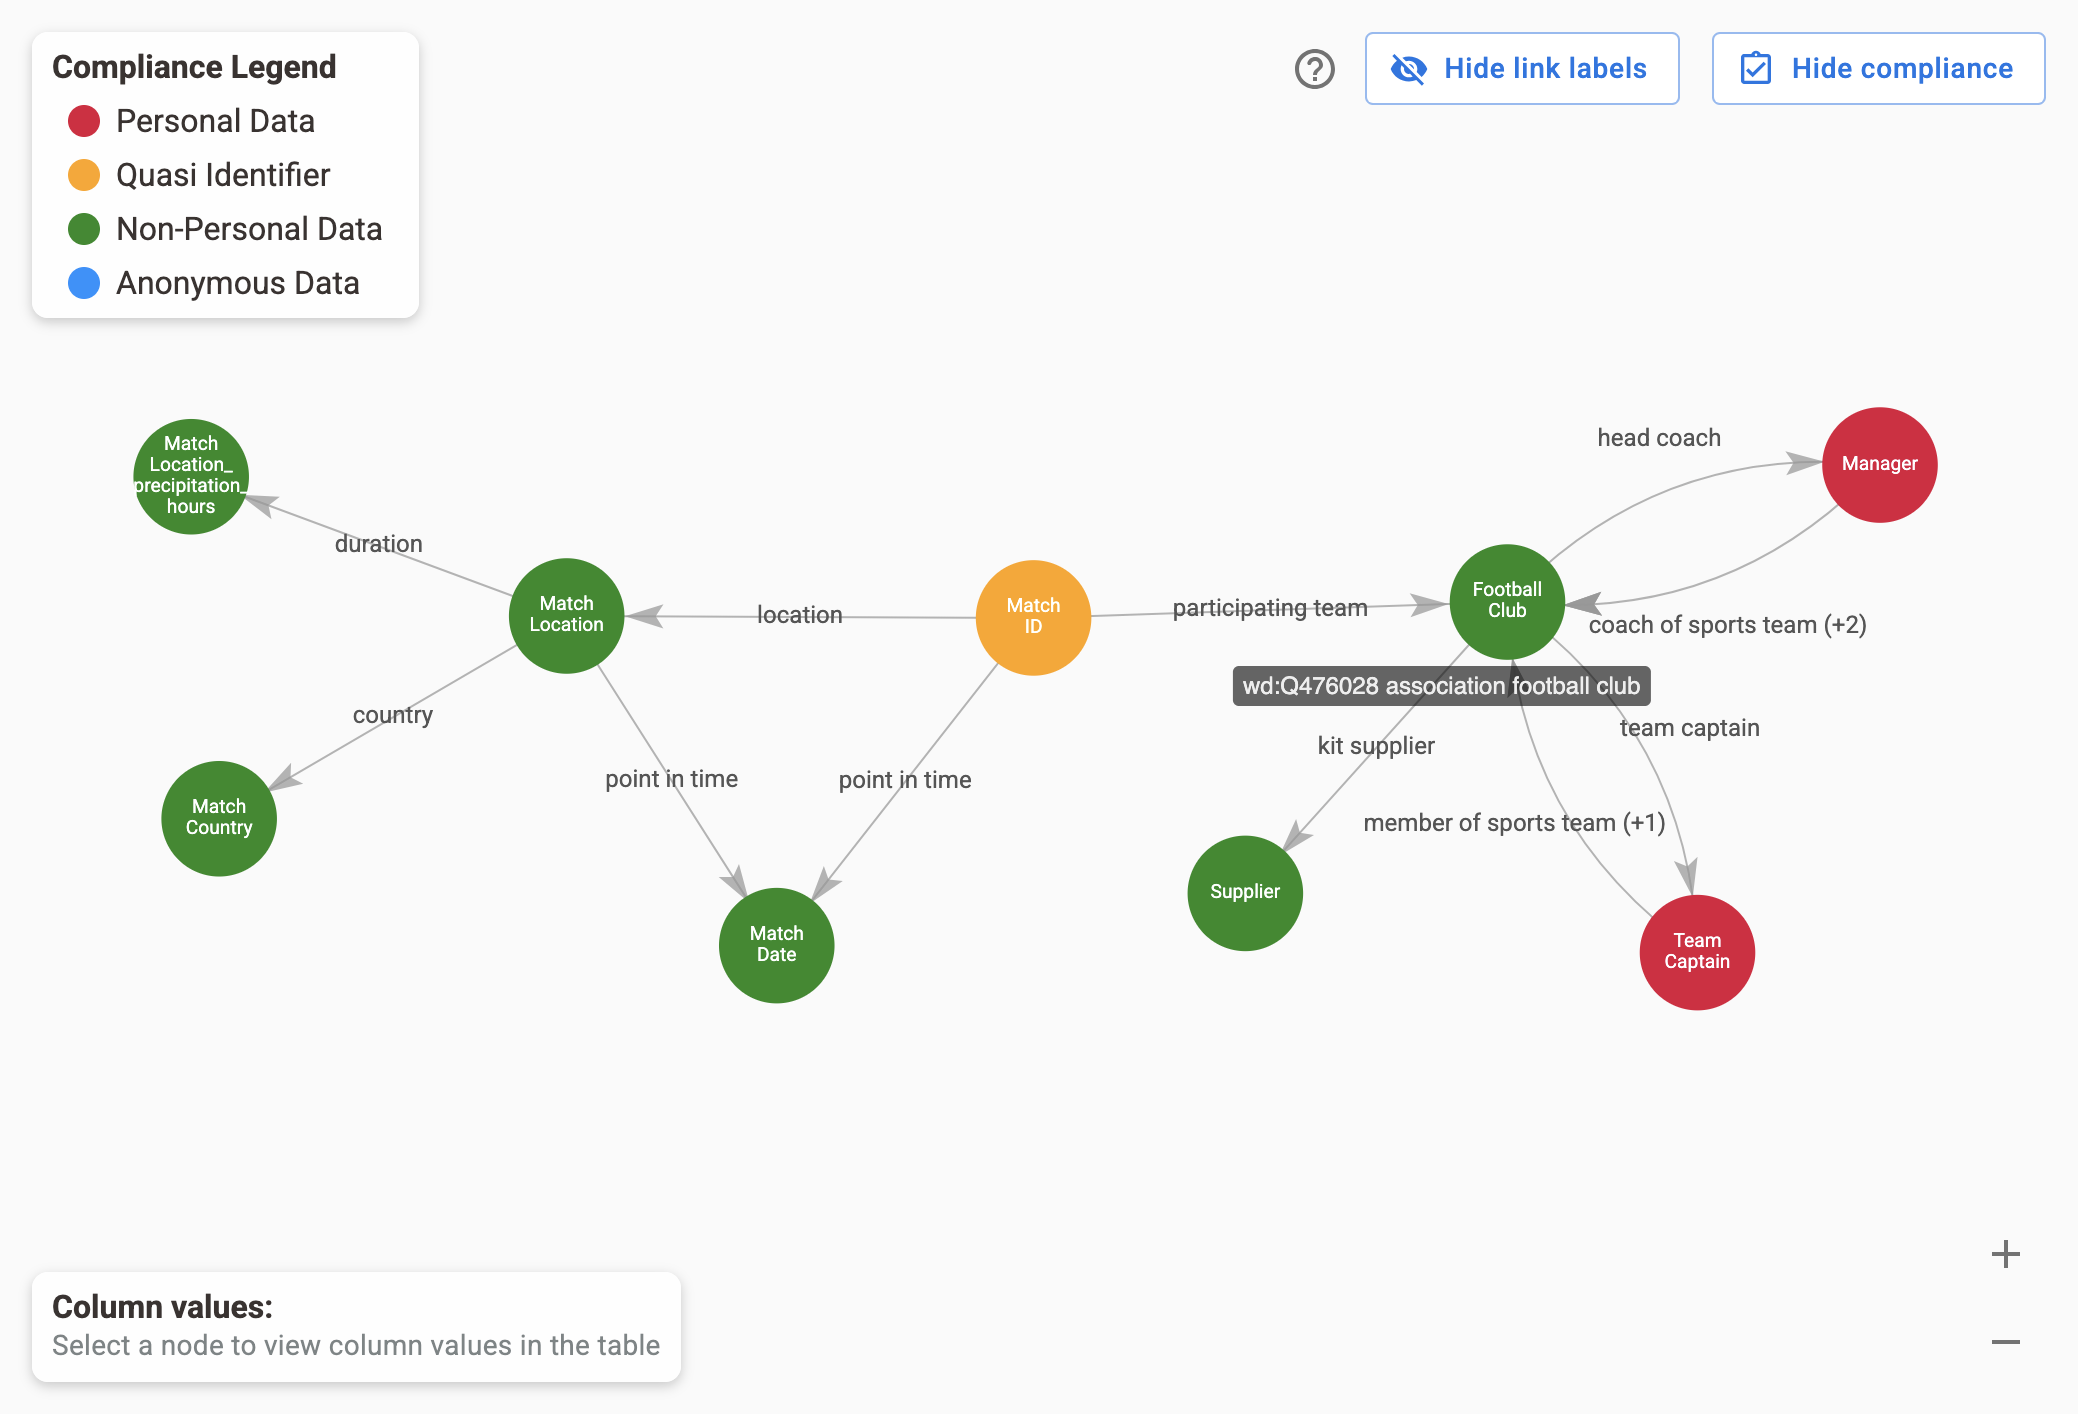
The Graph Area supports two visualization modes, toggled via the buttons in the top right corner:
- Standard View: The default mode, where node colors are determined by their basic semantic role.
- Subject: Main entities or key columns in the dataset.
- Entity: Related objects or semantic concepts connected to Subjects.
- Literal: Concrete values from the table (like strings, numbers, or dates).
- Compliance View: Activated by clicking the
Show compliancebutton. n this mode, node colors are determined by their data privacy classification.- Personal Data: Directly identifies an individual (e.g., name, email)..
- Quasi-Identifiers: Could indirectly identify a person when combined with other data.
- Non-Personal Data: Organizational or contextual information.
- Anonymous Data: Fully anonymized data.
You can explore and interact with the graph using the following actions:
- Hover over a node to display its metadata.
- Hover over a link to show its property and label.
- Hide/Show link label to toggle between viewing just the property or both the property and the label when hovering over a link by clicking on the respective button in the top right.
- Select a node to view its detailed information in the Sidebar and the corresponding data in the Column Values section.
- Select a link to view its detailed information in the Sidebar.
- Show/Hide compliance information to toggle between viewing the default schema and the one integrated with compliance status and classification by clicking on the respective button in the top right.
Column Values
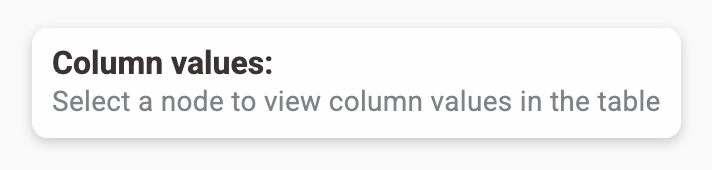
Located at the bottom left of the Graph Area, this section is tightly connected to node selection. Initially, the area displays a suggestion inviting the user to select a graph element. Once a node is selected, the table updates automatically to display the values of the corresponding column.
This view allows you to:
- Inspect the actual data values associated with a semantic node, scrolling through the table.
- Check the kind, semantic class for entities or datatype for literals, role and types of a node by observing its content.
- Identify patterns, repetitions, missing values, or inconsistencies in the data.
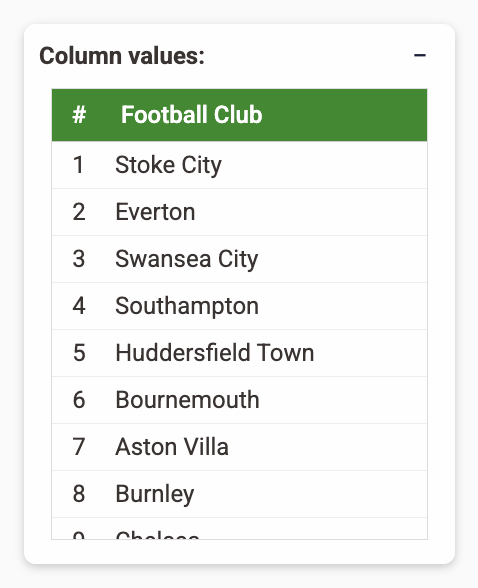
The Column Values table acts as a bridge between the graph representation and the concrete data stored in the dataset, supporting both semantic analysis and data quality inspection.
This section can be collapsed or expanded using the + and - buttons in the top right of the panel. When collapsed,
it allows for more space to view the graph.