Starting a project
Creating a project in SemT-X is the first step toward transforming your raw tabular data into semantically enriched knowledge. Once logged in, you will be redirect to the main dashboard.
tip
Watch this short clip (00:40 - 01:04) to see the authentication and dataset creation process in action:
Uploading or Creating a Dataset
Before importing your tabular data, you must either upload your dataset (supported formats: .zip or .rar) containing multiple tables or simply create an empty dataset by providing its name.
- From the dashboard, click on
+ NEW DATASET. - In the Add dataset Dialog, enter a Dataset name.
- Upload a compressed dataset or create an empty dataset.
- Click
Confirmto initialize the dataset.
Uploading a Table
Once your dataset is created and within the dataset view, you can import your specific data files (supported formats: .csv or .json):
- Click on
+ NEW TABLE. - In the Add table Dialog, select the file from your file system.
- Optionally, provide a Table name.
- Click
Confirmto import the table.
Searching for Datasets and Tables
As your workspace grows, you can quickly locate specific projects using the Search Bar located at the top of the dashboard.
- Hybrid Results with Labels: The dropdown menu displays both Datasets (folders) and Tables (files). To help you
distinguish between result types, each item is marked with a specific label on the right (
datasetortable). - Direct Access: Clicking on a
tableresult will take you directly to its table viewer, bypassing the dataset folder navigation.
Entering the Workspace
After the upload is processed, your table will appear in the list within its dataset. Clicking on the table name will open the Table Viewer, where you can begin the semantic enrichment process.
Reviewing Tables
Once your data is uploaded, you can quickly review the status of your tables directly from the dashboard using the quick action buttons located next to each table name (visible on hover):
- Compliance Report: Opens a window to view the latest compliance check (e.g., GDPR). (Learn more about Compliance Check)
- Schema Graph: Displays a visual representation of the table schema. (Learn more about Graph View)
- Pipeline: Opens the operation control panel. You can inspect these operations either in a sequential list or in a tree view, which illustrates the logical dependencies and helps you trace the enrichment workflow. (Learn more about Pipeline Control)
Advanced Viewing Modes
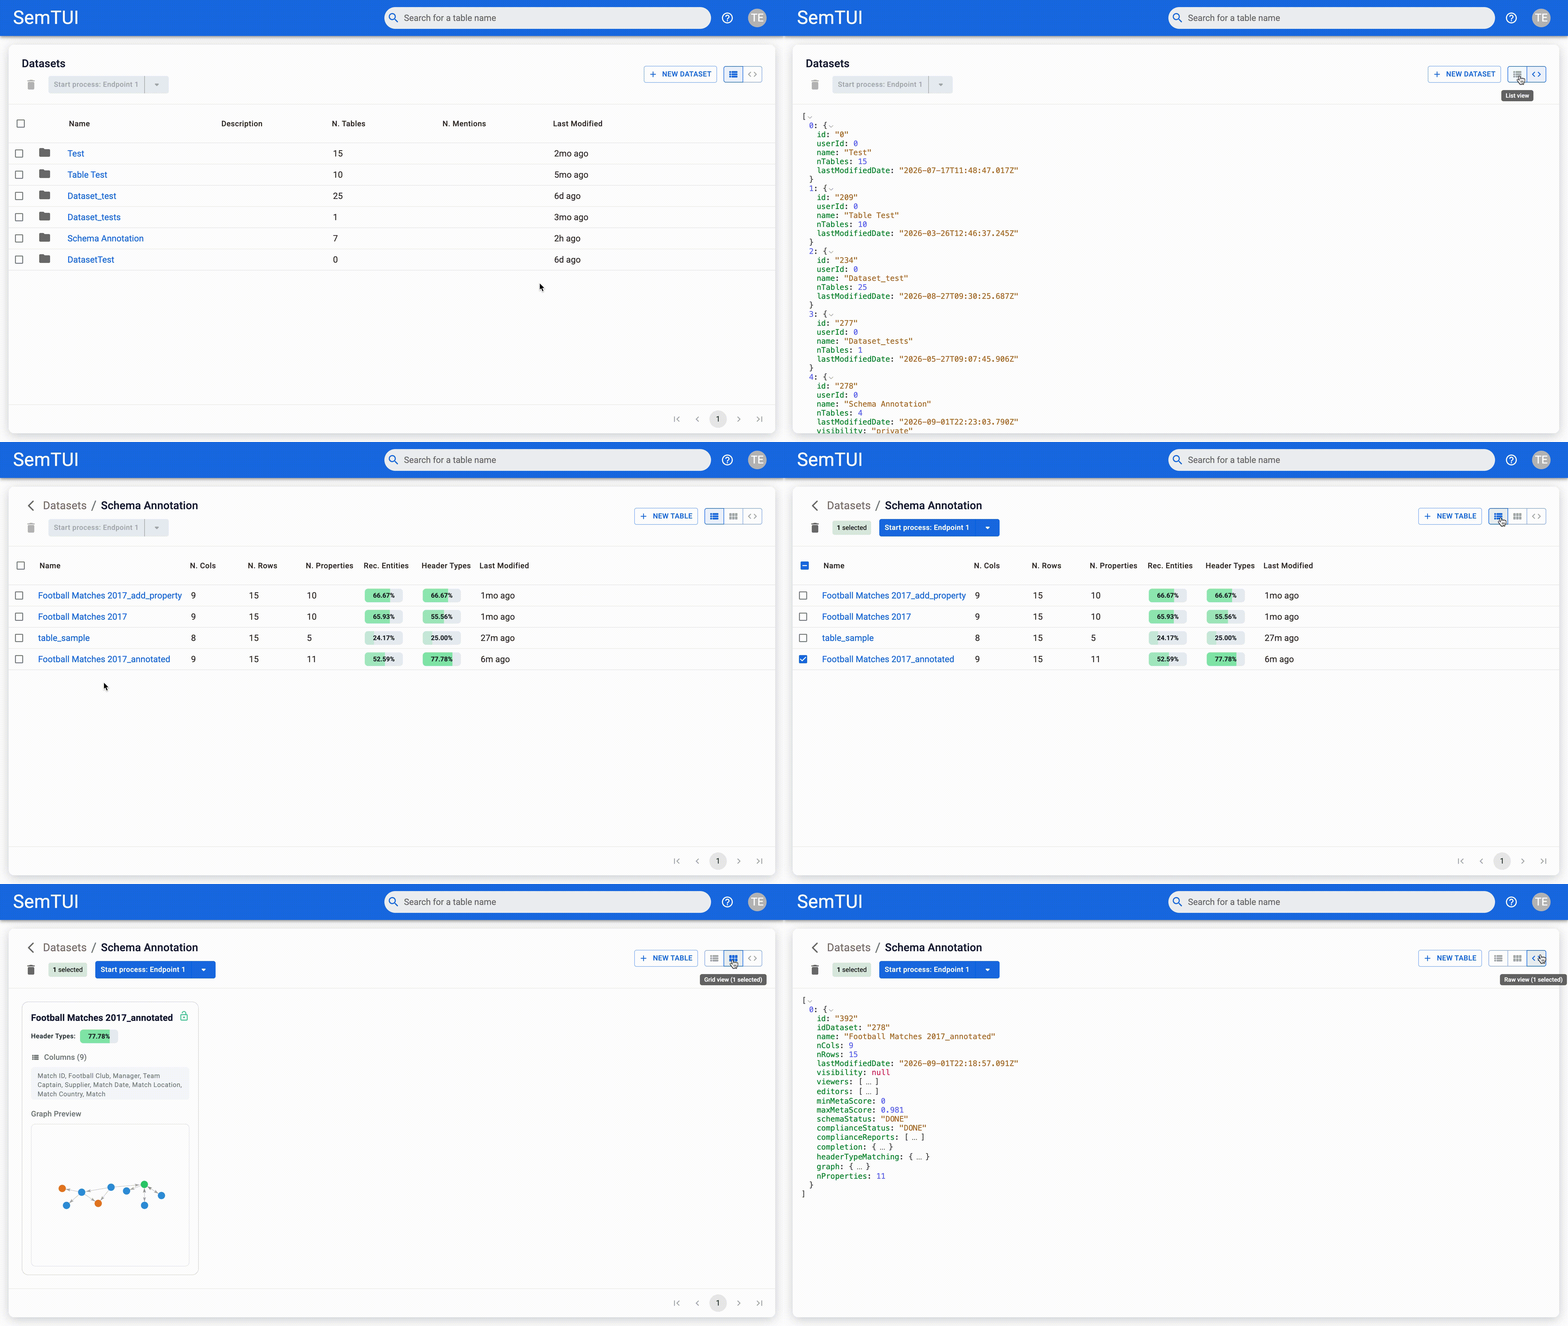
SemT-X offers specialized view toggles to inspect your datasets and tables structurally:
- Datasets: Switch from List view to Raw view inspecting datasets in JSON format. If specific datasets are selected, the view dynamically filters to show only those items; otherwise, all datasets are displayed.
- Tables: Toggle between List, Raw and Grid view. The last one includes a Schema Graph preview along with the detailed list of columns for each table. Just like the datasets, selecting specific tables filters the output, while leaving everything unselected displays all tables.