Visualization
SemT-UI offers several ways to visualize tabular data, depending on your specific task or the required level of detail. The available modes include:
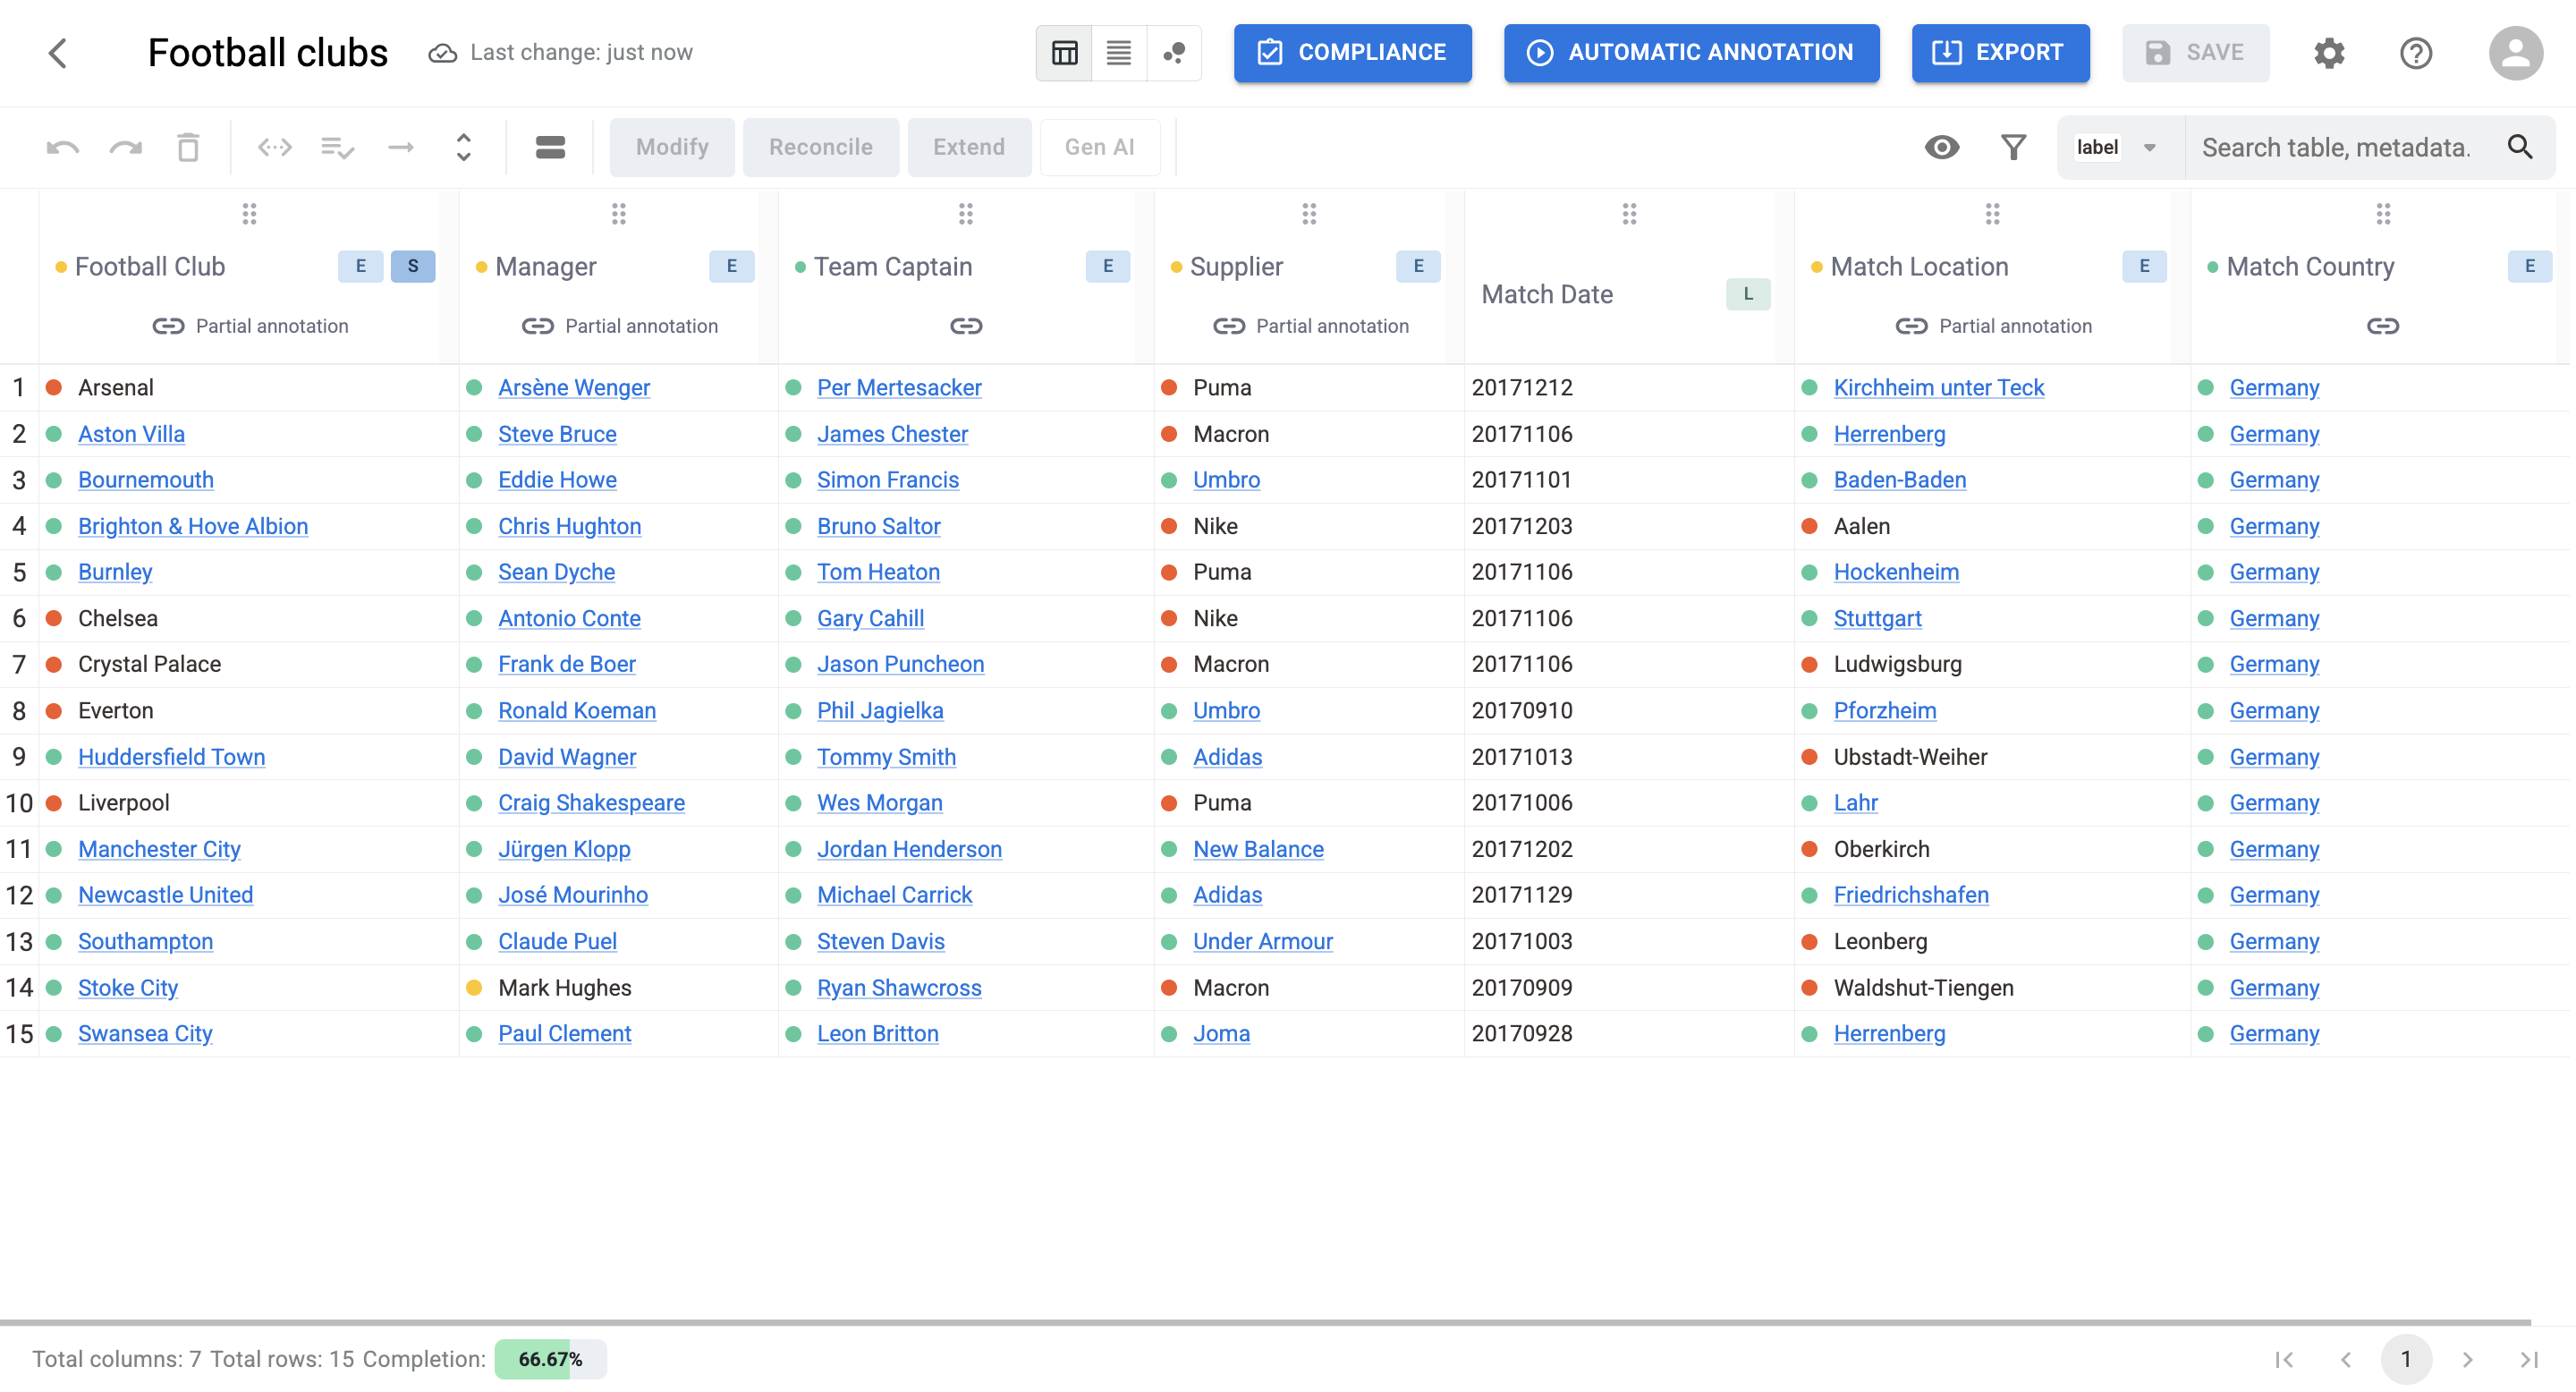
Table view: The default mode, which displays data in a structured tabular format. From here, you can directly interact with cells, rows, and columns to apply filters, manage annotations, and perform enrichment operations. (Learn more about Table View)
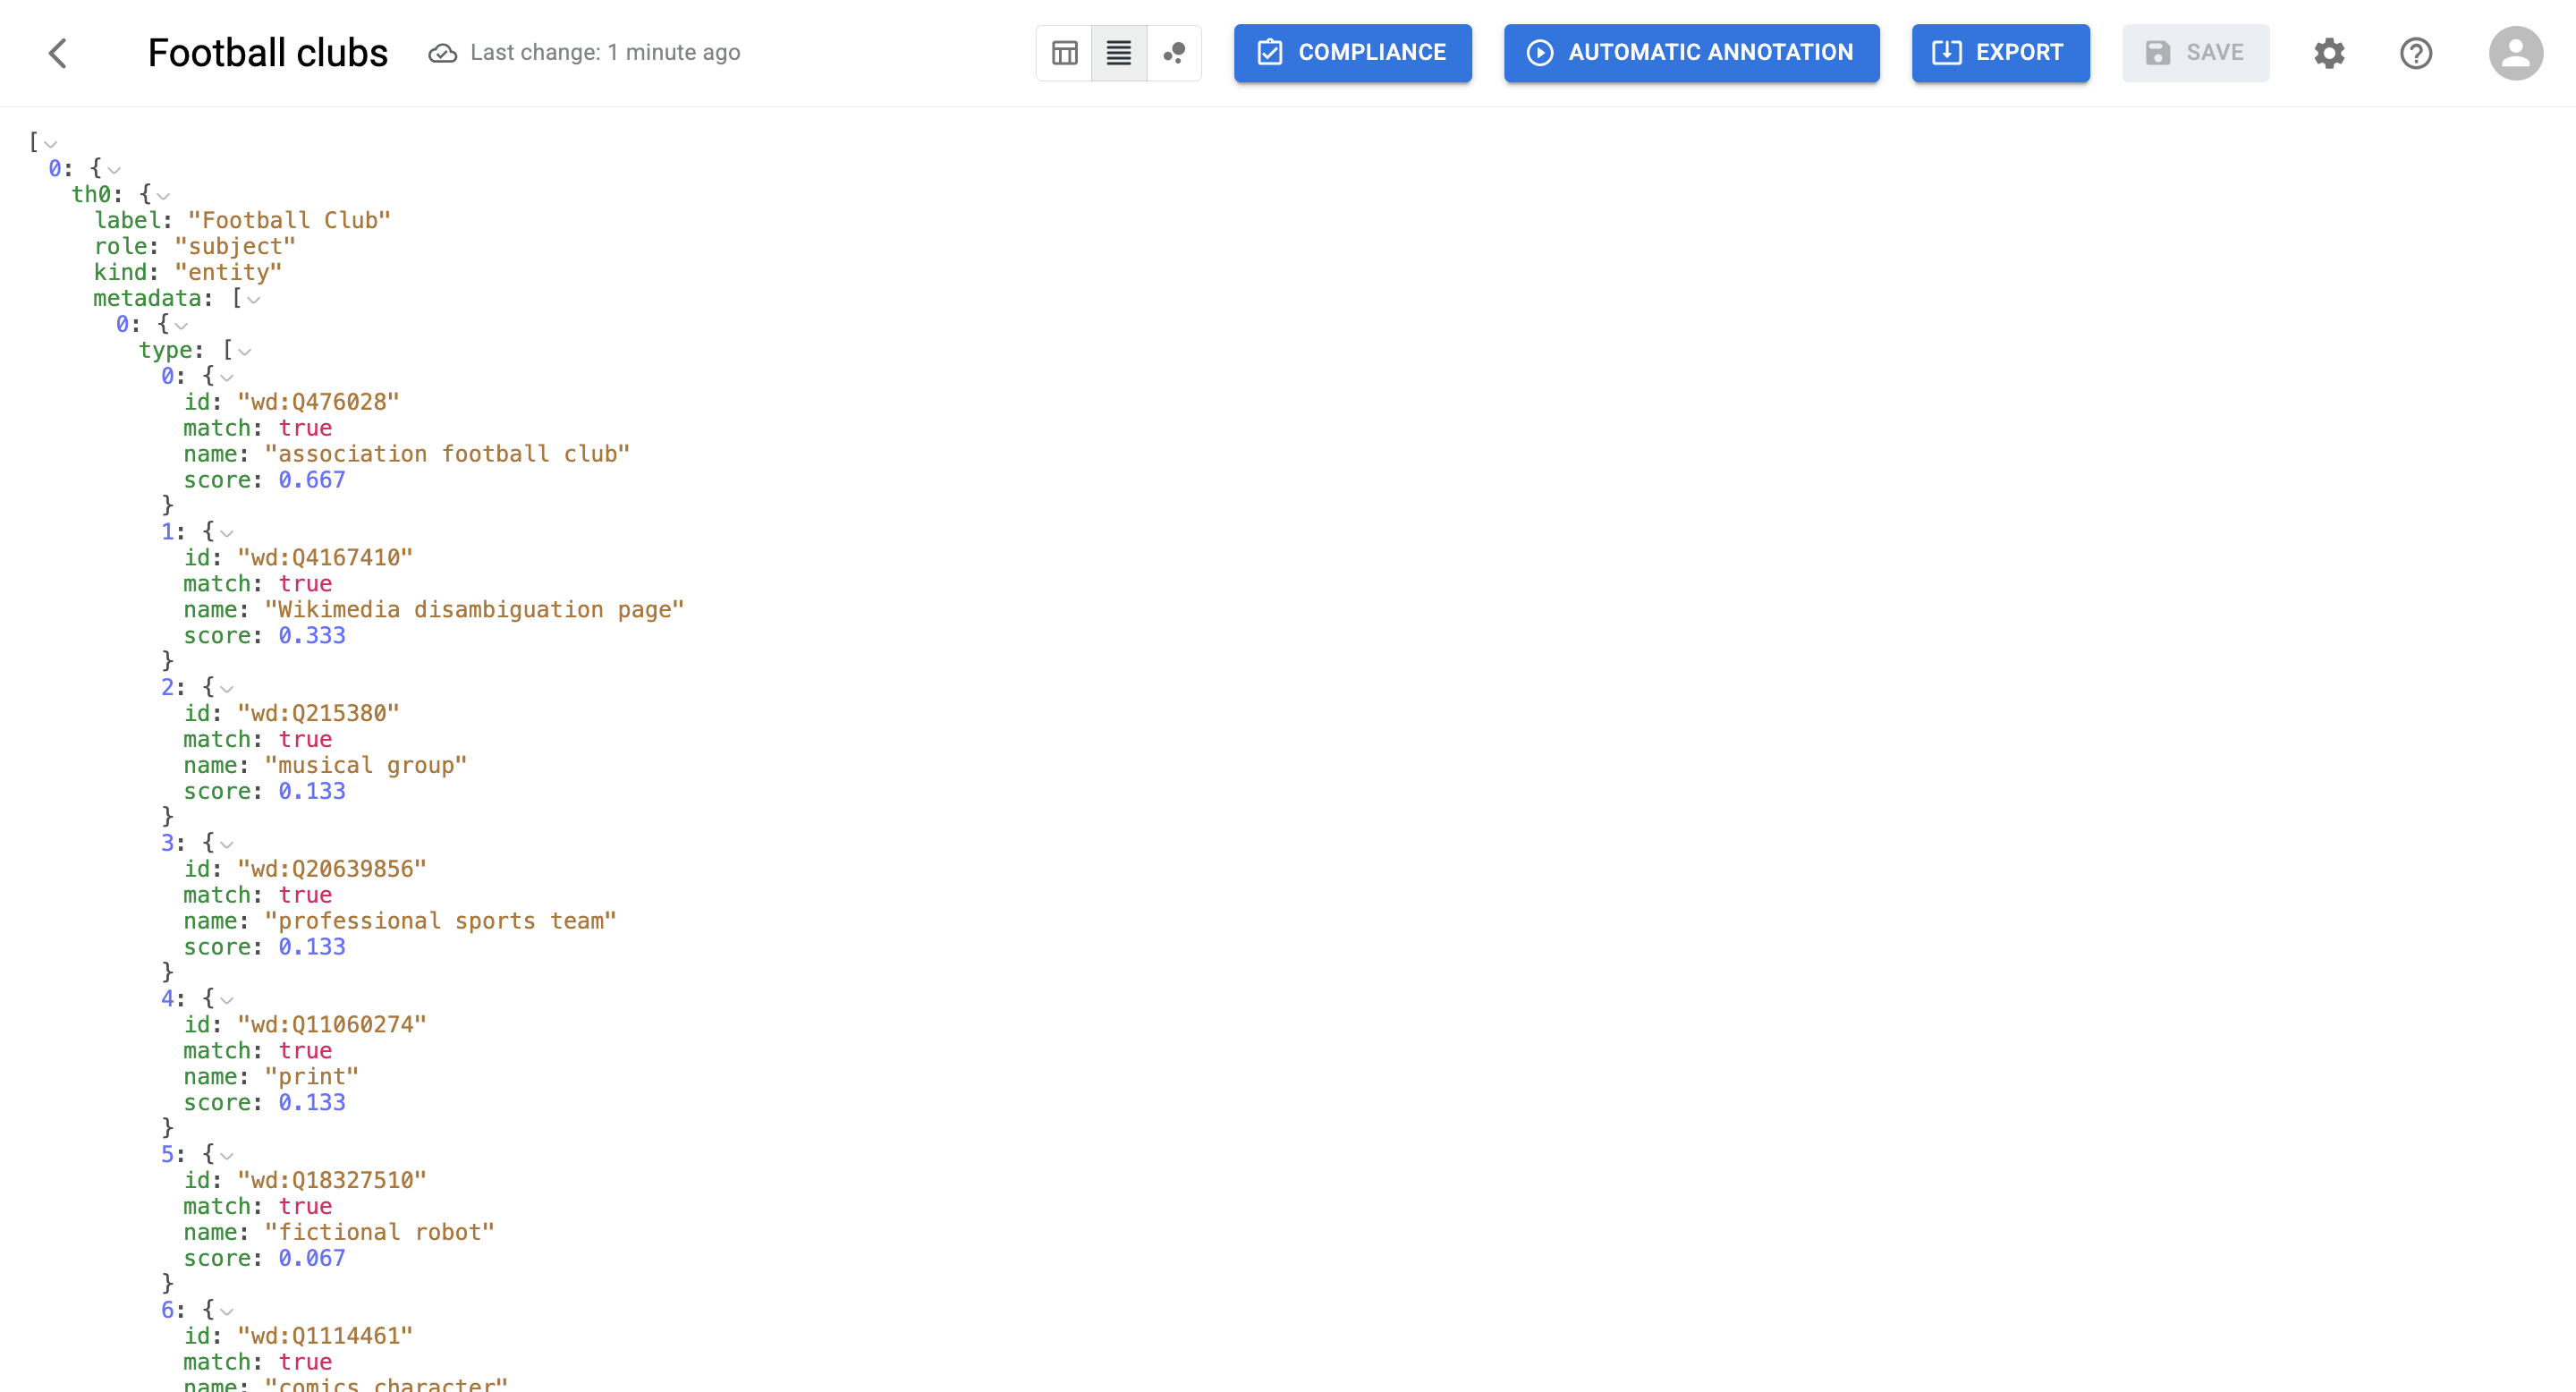
Raw view: This mode exposes the underlying JSON representation of the table, including both column definitions and row data:
- Columns: Each column (e.g., th0, th1) contains metadata, labels, and contextual information.
- Rows: Each row object uses column names as keys, with values representing the cell content, associated labels, metadata, and contextual information.
You can expand or collapse these elements to inspect their structure, making this view ideal for debugging or for those interested in the raw data model.
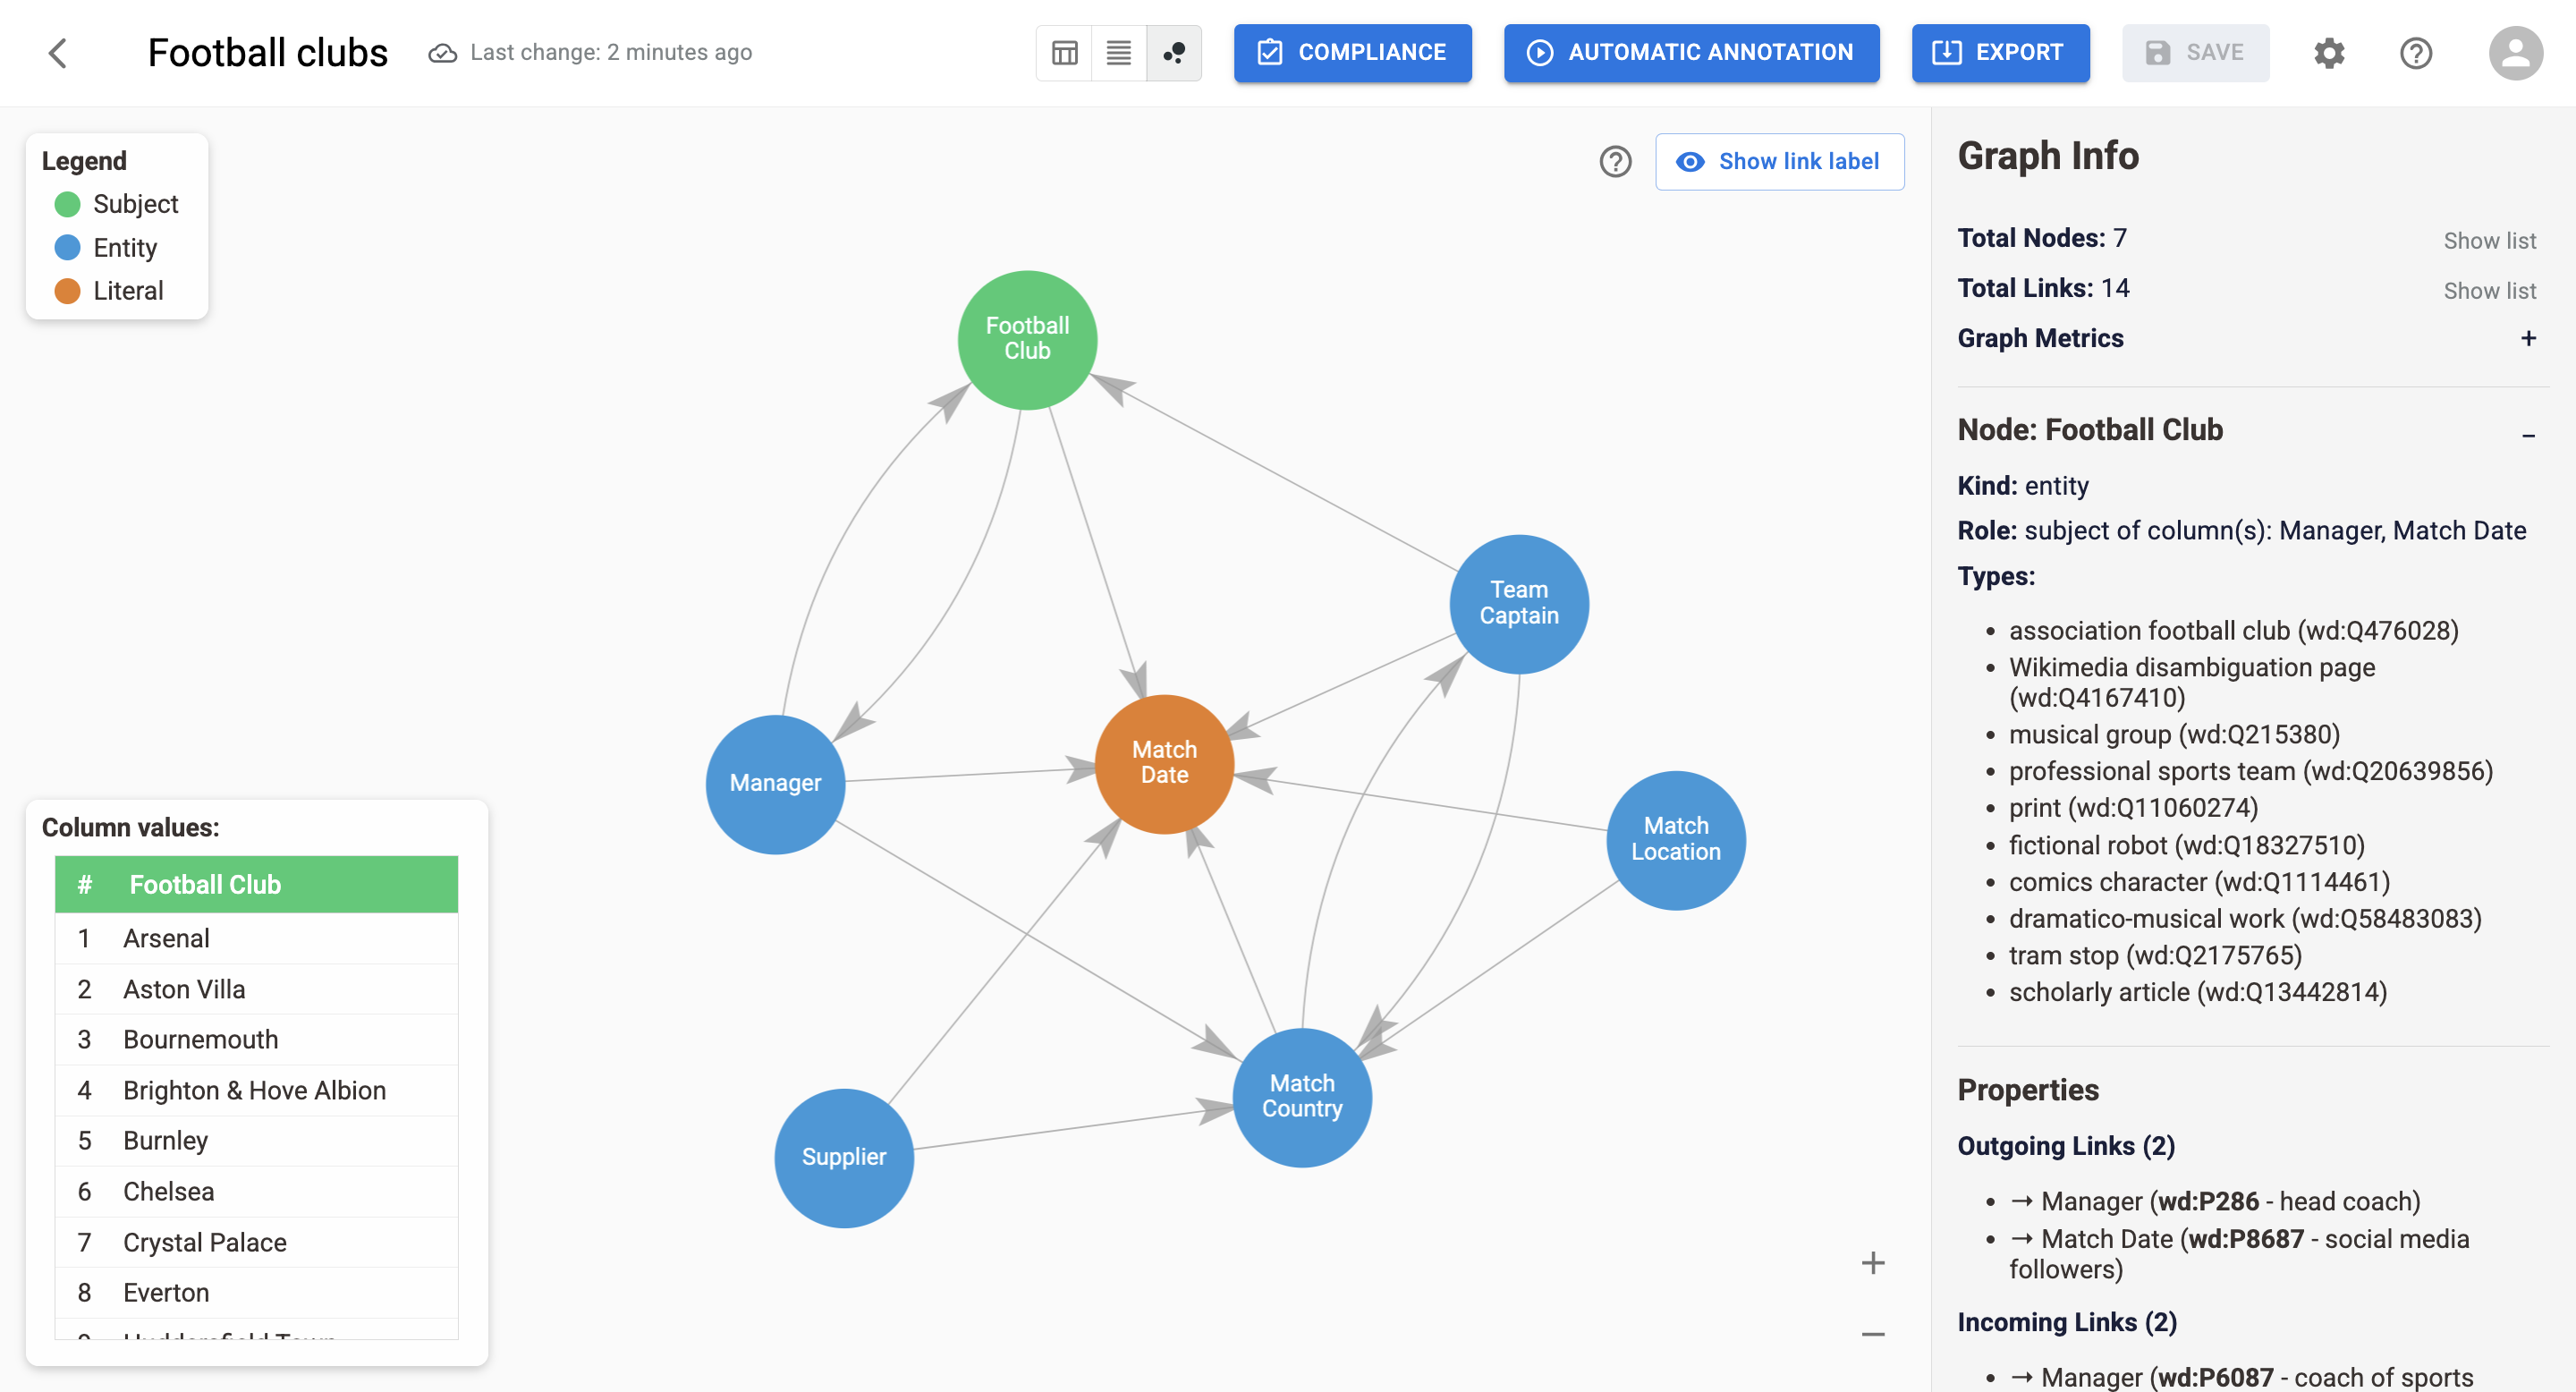
Graph view: This view maps the table as an interactive graph, where nodes represent columns and links show their semantic relationships. It simplifies exploring the dataset's structure and helps you understand how different columns are connected. (Learn more about Graph View)